
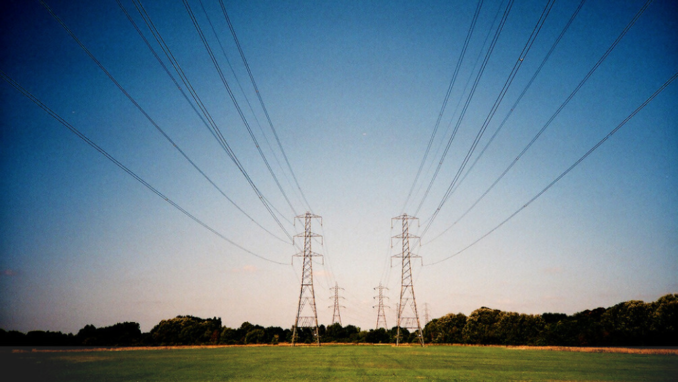
Electricity Pylons,
Nick Page – Licence CC BY-SA 2.0
The Market
A market is a place where supply meets demand, where wants and needs meet goods and services. A perfect market would be nothing other than that but, apart from thee ‘n me, nothing in life is perfect. In reality, marketplaces include fear and greed, stupidity, hubris, superstition, cultural obligations and, in recent times, a mountain of rules, regulations, lobbying, virtue signalling, climate crap, green nonsense and carbonphoblia.
Emerging from the chaos are two certainties. If supply exceeds demand, prices fall as providers chase after customers. When demand outstrips supply, prices rise as money chases after goods.
Which brings us to electricity supply in the UK. At the moment, according to the Department for Business, Energy & Industrial Strategy’s UK Energy in Brief 2020, the difference between maximum winter demand and capacity is 45,000 MW / 65,000 MW. An apparently comfortable ‘electricity margin’ of 20,000 MW, higher than for most of the previous two decades.
However, across the next ten years more generating capacity is being lost than being built.
Table 1: UK supply being lost.
| Closing | Location | Type | Lost |
| 2022 | Radcliffe | Coal | 2,000 MW |
| 2022 | West Burton | Coal | 2,000 MW |
| 2022 | Hinkley Point B | Nuclear | 840 MW |
| 2022 | Hunterstone B | Nuclear | 830 MW |
| 2024 | Hartlepool | Nuclear | 1,190 MW |
| 2024 | Heysham 1 | Nuclear | 1,160 MW |
| 2030 | Heysham 2 | Nuclear | 1,240 MW |
| 2030 | Torness | Nuclear | 1,205 MW |
| Total | 10,465 MW |
The reason for the strange outputs on the nuclear power stations is because they’re clapped out and run at less than installed capacity. Heysham 2 was built when the author was a student. He’ll be 60 next year.
Table 2: New UK supply in the next decade.
| Opening | Location | Type | Gained |
| 2027? | Hinkley Point | Nuclear | 3,300 MW |
| 2021 | Northsea | Interconnector | 1,400 MW |
| 2023 | Viking Link | Interconnector | 1,400 MW |
| Total | 6,100 MW |
Those two new interconnectors join the National Grid to Norway and Denmark respectively.
As can be seen from the above two tables, across the next decade the UK loses 10,465 MW of capacity but gains only 6,100 MW. By 2030 a net loss of 4,635 MW. All else being equal, the electricity margin drops to a still respectable 15,365 MW.
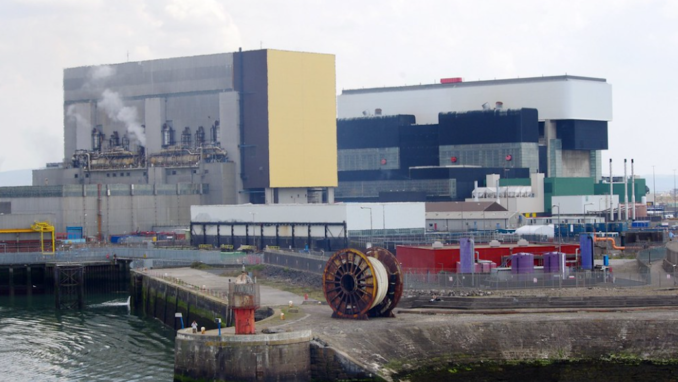
Heysham Nuclear Power Station,
Jim Linwood – Licence CC BY-SA 2.0
Added to which, we do not have to generate for ourselves but can import ‘greener’ electricity from the continent via interconnectors. According to National Grid[1] in the first six months of 2020, 9% of our electricity was imported. This would be equivalent to 3,150MW of supply at the peak of an ordinary day.
Table 3: Current UK interconnectors
| Interconnector | To/From | Capacity |
| IFA & IFA 2 | France | 3,000 MW |
| Nemo | Belgium | 1,000 MW |
| BritNed | Holland | 1,000 MW |
| Moyle | Northern Ireland | 500 MW |
| East-West | Republic of Ireland | 500 MW |
As we export to Northern Ireland and the Republic of Ireland, by 2023 the other interconnectors should be able to import a maximum of 7,800MW, or about 19% of peak demand – assuming electricity is available to us.
Can these imports be relied upon? Possibly not.
Although over 90% of Norway’s electricity is generated via hydropower, it is done via a large number of small plants making it an intermittent supply susceptible to disruption by rainfall. As Energi Fakt Norge[2] explains:
Inflow varies considerably during the year and from one year to another. It is highest in spring [because of the melt], normally declines towards the end of summer but increases again during the autumn. Inflow is generally very low in the winter months [because of the freeze, inconveniently when demand is highest].
Unconvinced? An early October Bloomberg headline reads, “Europe’s Power Crisis is Moving North – Norway reservoir levels at lowest for more than a decade. Hydro energy exports to Europe, the UK may face limitations.”
Over the other North Sea connection, the Danes claim 57% of their electricity comes from wind power – another intermittent source disrupted by seasons and weather.
At the other end of the Dutch interconnector, 81% of Holland’s electricity is generated by fossil fuels[3]. As the country de-carbonizes, a hole appears in electricity production there. Holland already imports more electricity than it exports, meaning much of the current passing through the interconnector is coming from further afield.
Neighbouring Germany is the big exporter. In 2020, 24% of generation was by coal, two-thirds of that from lignite (also known as brown or ‘dirty’ coal). Natural gas contributed another 12%. As Germany de-carbonises there will be less, if any, German electricity available for export.
As electricity is a commodity and it all goes into the same grid, how can our National Grid website claim the Dutch interconnector is importing green electricity when 81% of generation in Holland is produced by hydrocarbons and 36% in exporting neighbour Germany? Presumably by buying carbon credits with your money in order to astroturf imports.
As for the interconnectors themselves, the process isn’t simple. The domestic interconnector between England and Scotland swallows up more farmland every year and presently covers 33 acres. Presumably the never-ending expansion is needed because of intermittent supply and varying frequencies caused by growing wind farms. Undersea connections are even more complicated with pylon current (HVAC) having to be converted to undersea cable current (HVDC) and back again.
Does it matter if the interconnector supply is unreliable if we can still generate more electricity than we use?
Mention of seasonal and weather affected generation puts a question mark beside our wind farms and eats into our electricity margin further. Despite glowing reports that wind energy is now the cheapest form of electricity, a look at the government’s own figures suggests a different story.[4]
According to the Office of National Statistics (ONS) regarding 2019:
- The wind industry turned over nearly £6 billion
- The installed capacity of the wind farms was 23,882 MW
- Electricity generated by them was 63,795 GWh
If we do the mathematics (64,795,000 MWh \ £6 billion), we find that wind-generated electricity costs £94.05 per megawatt, well above the present £70 wholesale price. When Bloomberg runs headlines that include phrases such as “Solar and Wind Cheapest Sources of Power”, read the small print, add a pinch of salt, read the microscopic print and then reach for more salt.
Likewise, (63,795 GWh/365/24) shows that on average, 7,200 MW of wind farm capacity was being used – only 30% of the installed total. In 2021, the figures will be even lower because of numerous windless spells, especially in April and September, when wind’s contribution to overall supply slipped below 1%.
It would be churlish to expect wind farms to operate at 100% capacity but excessive inefficiency has to be covered by other forms of generation. If we look at Ofgem’s de-rating statistics for winter 2013:
Table 3: Capacity available by type of generation (winter 2013)
| Type | % of installed capacity available |
| Coal/ Biomass | 88% |
| Gas | 85% |
| Nuclear | 81% |
| Oil | 82% |
| Wind | 17-24% |
The difference between what’s installed and what is available is known as the ‘de-rating’. It would be fair to say wind’s de-rating is 50% greater than other forms of generation and therefore has to be covered by extra installed capacity. That’s a build of 12,400MW, the equivalent of four Hinkley Points.
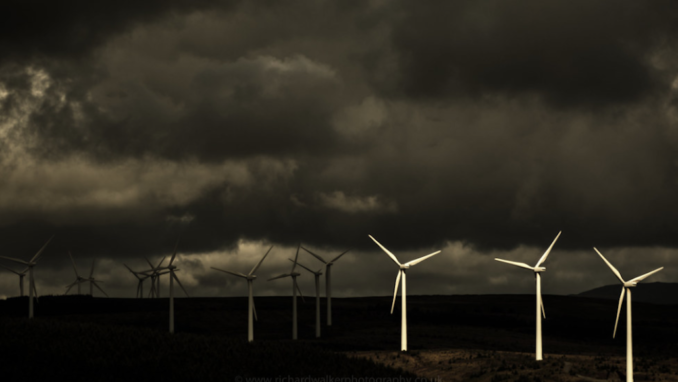
Wind farm,
Richard Walker – Licence CC BY-SA 2.0
So why is wind power so expensive and inefficient? Amongst other things, because the turbines don’t work below a 10 mph wind speed and have to be switched off to stop them being damaged at over 50 mph. Also, to prevent them from freezing up current has to be supplied to them in cold, still weather. Plus, there just isn’t a lot of energy in moving air. Burning a gallon of petrol in the engine moves my car 40 miles. Blowing a gallon of air on it moves it not at all.
As for the rents paid ….
The Guardian covered the issue as landowners jumped on the bandwagon in 2012;
Estate owners in Scotland – where 1,200 people own two-thirds of the land – have so far benefited the most. The Earl of Moray is thought to get about £2m a year in rent from a 49-turbine wind farm on his Doune estate in Perthshire, while the Duke of Roxburghe stands to make more than £1.5m a year from his 48-turbine Fallago Rig development in Lammermuir Hills. According to this analysis, the Earl of Seafield, Britain’s seventh-largest landowner, would be paid around £120,000 a year from turbines on his Banffshire estate. The Earl of Glasgow, a Liberal Democrat peer, has 14 wind turbines on his Kelburn estate, so could earn upwards of £300,000 a year.
Remember, an energy company does all the work and takes all the risk. The landowner is just paid for the use of the land.
One such landowner was Iain Kennedy-Moffat, one of five involved with a series of developments proposed around Loch Urr in Dumfries and Galloway. Ian farms 2,000 acres (of the 6,000 in the wind resource area), where he raises Blackface hill sheep and Galway Cattle.
In interview with the Glencairn Gazette, Ian helpfully pointed out to journalist Sue Grant that, “It isn’t about the money.” Not completely convinced by the environmentalists, cattle farmer Ian has posted a graphic on his social media poo-pooing the idea of greenhouse gas methane being caused by beef production. He adds, “How much methane is produced by those following none meat diets?”
One of the wind farms in the area is Blackcraig. According to documents lodged at Companies House, the facility consists of 23 turbines with a total generating capacity of 52.9 MW. In the year up to 31 December 2020, it made a profit of £2.3 million and is valued at a cool £89 million.
Blackcraig sold 172,570 MWh of electricity for £16,900,000 suggesting 37% efficiency at £97/MWh – very close to the government’s own somewhat hidden calculations.
The inefficiency of the wind farms puts more pressure on our electricity margin but it hardly matters if, across the coming decades, people are going to consume less. With that in mind, having looked at supply, let’s take a look at the other side of the equation – demand.
Future UK Demand For Electricity
As we reach 2030 and that 4,365 MW drop in electricity capacity we also reach the point where new diesel and electric engines are banned.
The Financial Times estimated that a complete transition would require an extra 18,000 MW of extra generating capacity. Carbon Brief reckoned 6,000 MW but assumes a big change in lifestyles including not owning a car. You will share journeys with strangers in self-driving taxis. En cue Sizewell B closes in 2035, removing another 1,195 MW from the National Grid.
Such a big range of estimates demands a Puffin does his own calculation. As petrol and diesel are taxed to death, it is possible to find out via the Government’s Digest of UK Energy Statistics (DUKES) how much is sold – 38 billion litres in 2020. As every schoolboy knows, diesel produces 10.9 KWh of power per litre, petrol 9.6 KWh.
The US Environment Protection Agency tells us that between 12% and 30% of the energy produced by an internal combustion engine is available to move the vehicle. In electric vehicles, it is 80-85%. After doing the maths, I came up with 13,000 MW of extra demand, or another 4 Hinkley Points, to replace diesel and petrol road transport with electricity. That’s assuming they are evenly re-charged throughout the day.
In August 2021, there were 300,000 EVs on the road out of a total of 31 million vehicles, less than 1%. Therefore 99% of the 13,000 MW will be new demand.
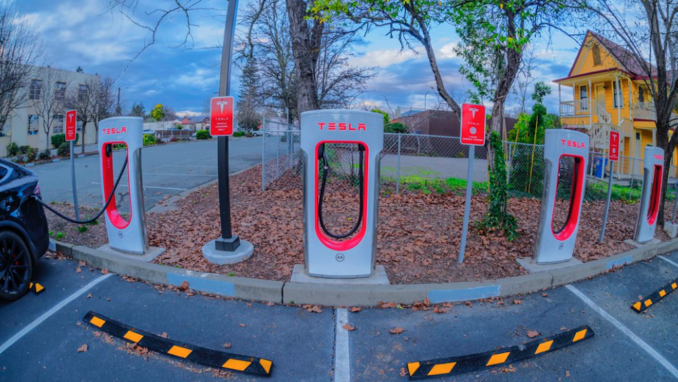
Tesla Feeders, Ukiah, California,
Bob Dass – Licence CC BY-SA 2.0
Gas boilers will be banned from 2025 and replaced by heat pumps. According to Viessmann, the average UK home requires 12,000 KWh of energy per year to heat it. According to Idealhome, there will be 2.5 million heat pumps in UK homes by 2030.
As a heat pump compresses and concentrates the existing heat out of air, it uses a third of the energy that it produces, suggesting 4000 KWh per annum for central heating. But that demand will be seasonal and at peak times of the day. Also, the heat exchanger doesn’t get as hot as a burning gas flame, requiring much larger radiators and providing lukewarm hot water. Plus, the air contains the least heat (cold weather) when you need heating the most, meaning radiators will need extra electricity from the mains.
This made the calculation difficult. I got it to 1.14 MW, for the 2.5 million homes by 2030. For all 27.8 million UK households – 17,000 MW at peak times. Another five Hinkley Points.
Important Point
In order to make reasonable comparisons between different years, DUKES publishes the average annual temperatures next to their ‘energy used for heating’ statistics. Guess what? The 2010s were colder than the 2000s.
Remember, people are not rational, they are emotional. Global warming, rising sea levels and climate change are superstitions. Fear of carbon is a medieval-style irrational panic.
Conclusion
An older generation of nuclear power and coal power stations are going off-stream and not being adequately replaced. Interconnectors are unlikely to run at full capacity. Wind farms are inefficient. Banning hydrocarbons for heating and transport creates massive extra demand for electricity.
Our electricity margin is about to become a giant electricity deficit.
In the marketplace, prices will rise bigly. You will use your compulsory smart meter to bid for electricity hour by hour. Most of you will have to do without. Food will be eaten raw. You will sit in the cold and the dark. Flicking a switch will be as difficult as finding a dentist, seeing a doctor, visiting a care home or getting your children into a school.
Or will it?
Next time we’ll look at the options available to prevent the approaching UK electricity supply bloodbath.
References
[1] National Grid Interconnectors
[2] Energi Fakt Norge
[3] Dutch Electricity
[4] ONS Energy statistics
© Always Worth Saying 2021
The Goodnight Vienna Audio file