Puffins, Puffins, pay attention, please. Free time is over, so put away your things and we are going to have a nice story, so gather over here, make a circle on the floor all around me, and we’ll tell the story together. JwP, please let go of Zippy’s ear and settle down. Do come along, everybody. Rick, come out from under the table and join in the fun. No, you’re not in a space rocket. You can’t wait for the count-down, you come out now. Don’t you want to help us tell our nice story, Rick? Then say, ‘No, thank you.’ And stop machine-gunning everybody, please. And Craig, stop being a train and sit down. All right then, get into the station and then sit down. Well Chuffed…………..Please don’t do that. Now…………Let’s have some nice straight backs, shall we?
So, let’s all go back to the year of 1812, when Napoleon is doing pretty well for himself. He has most of Europe under his control, except for the UK. His plan was to place an embargo on the “nation of shopkeepers”, forcing other European countries to stop trade with the UK which would weaken them enough so that Napoleon could invade and complete his European Project. Czar Alexander of Russia, however, saw that Napoleon was becoming too powerful, and refused to participate in this embargo. Angry at Czar Alexander’s decision, Napoleon gathered a massive army of over 400,000 to attack Russia in June. While Russia’s troops are not as numerous as France’s, Russia has a plan. Russian troops keep retreating as Napoleon’s troops move forward, burning everything they pass, ensuring that the French forces could not take anything from the land. Eventually, the French army followed the Russian army all the way, arriving in Moscow during October, whilst suffering grievous losses from lack of food. By the time Napoleon got to Moscow, he knew he had to retreat. As winter settled into Europe and the temperature dropped, Napoleon’s troops suffered even more losses, eventually returning to France, a shattered force.
Annie Dee, please take your shoe off your head and put it on your foot. Upset, please don’t wander away like that. Yes, I know the window is over there, but you don’t want to look out of it now. Our story is getting much too exciting. Come and sit down by BQ. BQ, don’t pull your jersey down over your knees like that, you’ll get it all out of shape. Grumpy Angler & Sharpie, don’t copy him. I don’t want everybody pulling their sweaters down over their knees. Roger Ackroyd, whatever have you got in your hand? But we haven’t had toast and marmalade for two days……….. Where did you find it? In your pocket. No you can’t eat it… it’s all……..fuzzy. Now don’t touch anything. Go and put it in the waste-paper basket and then wash your hands. Mrs Raft, open the door for him. Don’t touch anything and hurry back, please.
Now let’s all take a look at the picture, shall we?
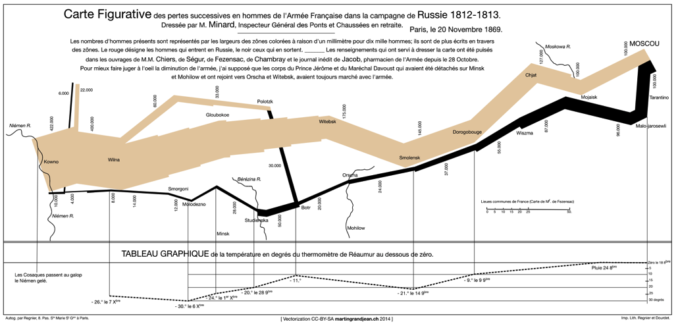
Minard’s Map (vectorized),
Martin Grandjean – Licence CC BY-SA 3.0
Click here to expand map.
Possibly the best statistical graphic ever drawn, is how Edward Tufte described this chart in his authoritative work ‘The Visual Display of Quantitative Information’, it is an early example of a Sankey diagram which we all know displays information as flows. It’s a chart, a statistical graphic, and also a map. And a strange one at that. It depicts the advance into (1812) and retreat from (1813) Russia by Napoleon’s Grande Armée, which was decimated by a combination of the Russian winter, the Russian army and its scorched-earth tactics. As a statistical chart, the map unites & presents six different sets of data :
• Geography: rivers, cities and battles are named and placed according to their occurrence on a regular map.
• The army’s course: the path’s flow follows the way in and out that Napoleon followed.
• The army’s direction: indicated by the colour of the path, gold leading into Russia, black leading out of it (In the original version)
• The number of soldiers remaining: the path gets successively narrower, a plain reminder of the campaigns human toll, as each millimetre width represents 10.000 men.
• Temperature: the freezing cold of the Russian winter on the return trip is indicated at the bottom, in the republican measurement of degrees of réaumur (water freezes at 0° réaumur, boils at 80° réaumur). So when it says that the temperature reached -30 °Ré on the 6th, it was actually -37.5 °C (-35.5 °F). Taters indeed….
• Time: in relation to the temperature indicated at the bottom, from right to left, starting 24 October (pluie, i.e. ‘rain’) to 7 December (-27°).
Let’s pause a moment to ponder the horrific human cost represented by this map: Napoleon entered Russia with over 400,000 men, took Moscow with only 100,000 men left, wandered around its abandoned ruins for some time and escaped the East’s wintry clutches with barely 10,000 shivering soldiers. And those include 6,000 rejoining the ‘bulk’ of the army from up north. Napoleon never recovered from this blow, and would be decisively beaten at Waterloo under two years later. Almost exactly 130 years later, Hitler would repeat Napoleon’s mistake by again underestimating both the vastness of Russia & the savage inhospitability of its winter. The map was the work of Charles Joseph Minard (1781-1870), a French civil engineer who was an inspector-general of bridges and roads, but whose most remembered legacy is in the field of statistical graphics, producing this and other maps in his retirement. Yet, the map has many more features, some hidden in plain sight. The events depicted were not contemporary when the map was designed, so this was already a historical map when it was created. The events took place in 1812/3, but Minard created the map 57 years later in 1869 – an eternity at a time when life expectancy in France was around 40 (interestingly, Minard lived to be 89 years old). It’s the equivalent in terms of todays generation creating a map of The Great War. Those paying attention will note that the march doesn’t start in France.
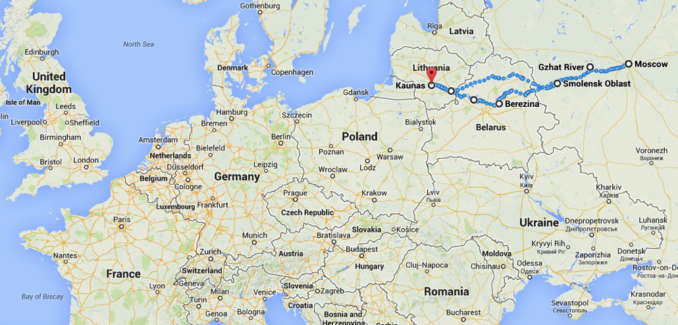
Google Maps
It starts in the then – Poland (now Lithuania),- at the Nieman River. By the way, Google Maps estimates that the trip from the Nieman River to Moscow and back would take 20 days of non-stop walking. The campaign lasted 174 days. The map doesn’t show the main cause of the losses. It is tempting to attribute the losses to the cold weather on the way back from Moscow, but a careful study of the map shows otherwise. By the time Napoleon reached the capital, he had already lost some 75% of his troops (322,000 out of 422,000). The main cause was starvation because the retreating Russian troops were burning the land, villages and crops to deny food to Napoleon’s army. The cold weather and battles on the way back took “only” another 20% of the original troops. The final calamity for the was the crossing of the Berezina river where some 20,000 lives were lost. It’s evident that this failure of a campaign weighs heavily – even today – on the French Military, who use the expression C’est la Bérézina to describe a total disaster.
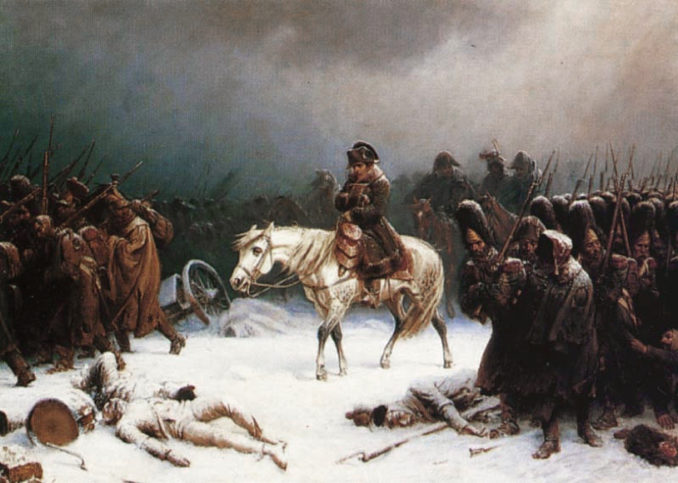
Napoleon’s retreat from Moscow,
Adolph Northen – Public domain
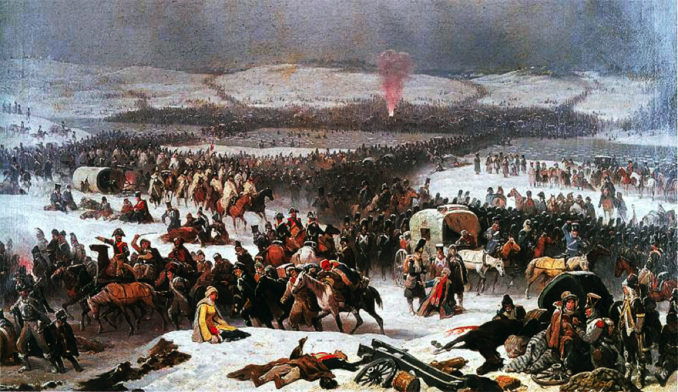
Huile sur toile de Janvier Suchodolski, 1866,
Suchodolski – Public Domain
Now, now MEB, don’t kiss BobC like that………Because he doesn’t like it. Yes, I know you like it, but he doesn’t………. I don’t know why he doesn’t like it, but he doesn’t. And you can’t go under the table and kiss Hogz, because he doesn’t like it either. Well, you didn’t like it yesterday, Hogz. You must learn to make up your mind, mustn’t you? No, GQ hasn’t *made* you change your mind….. Yes Terpsy ? …..no, this map doesn’t have any pictures of unicorns riding rainbows…….. I don’t know why, it just doesn’t. Oh good, Rick, you are coming out to help us tell… Well, 1776, I really don’t know why no-one wants to kiss you, perhaps ask your Mummy to occasionally clean your teeth ?………. Hebs 30, that’s r e a l l y not funny nor clever….. Madame Rev, Foxy, RP . . . everybody. . . come back here at once………….. Sometimes I don’t think I’m cut out for teeching, I just don’t know how OT copes with this lot in Remedial Maffs class…………
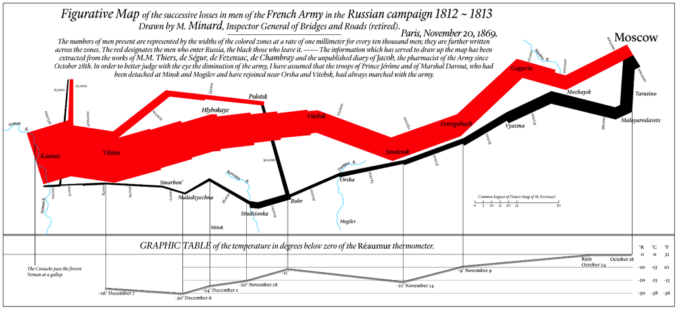
Minard Update,
DkEgy – Licence CC BY-SA 4.0
Click here to expand map.
© DJM 2020
The Goodnight Vienna Audio file

