
The statistics don’t lie. For some reason we are living much longer than previous generations, but why. Surely it cannot be down to rNHS, they seem to want us all dead as does this rubbish government and its WEF overlords; that last part applied equally to the previous government.
The ONS attributes increasing life expectancy since 1951 to health improvements such as the treatment of heart disease. I suspect a decrease in smoking in the last few decades also played a significant role. From 1890 to 1951 the increase is being attributed to things like childhood immunisation. It remains to be seen exactly how much change will be caused by the Covid jab.
You will see a couple of graphs further down, the second applies to male life expectancy. It would have been a bit confusing to add in the female data. Lady Puffins can rest assured they will still live longer on average than the male variety.
There are also pockets of low life expectancy in some towns. Glasgow used to hold the record with one part having a male life expectancy of a mere 54 years,. This was the national average around 1921. Glasgow has since been overshadowed by Blackpool. These rates are allegedly down to lifestyle. Drinking alcohol and smoking to excess does your health no good at all. Puffins beware and yet Blackpool lies next door to Lytham St Annes and that town hosts a well known puffin who seems to be older than Highlander.
One of the giveaways from the gummint was the 1911 census when, for the first time, they asked how many children a woman had borne and how many survived. They knew WW1 was on its way and were worried they would not have enough cannon fodder. Aren’t governments terrible.
Our diet has improved over my lifetime with much more variety and probably healthier options. Will this be sustained ? I note ever more ready prepared meals on supermarket shelves, this is not a good sign because such food is not going to improve your health. The health food fad has been eagerly adopted by those to whom we might not wish longevity. No doubt Jobby and Polly Twaddle will live long and healthy lives. Even the recently deceased Brian Wilson of Beach Boys fame reached 82 which oddly enough is just about the average male life expectancy in the UK. This was a man who consumed prodigious amounts of illegal substances, it is said that even Keith Richards was shocked at the quantities. It appears that if you are very rich you can afford the medical help required to keep you going.
But what of these statistics previously mentioned. The ONS provides a lot of data so let us have a dive into the contents. There is an average life expectancy for men and women of the UK but further split down into the four nations making up our Union. There are also tables of how many years someone of a certain number of years can expect to live. To my non mathematical mind it is extremely odd that the latest figures show that a male can expect to live to about the age of 82 years. On the other hand if you actually reach that number you can expect to live another 13 years. Averages are exactly that, an average.
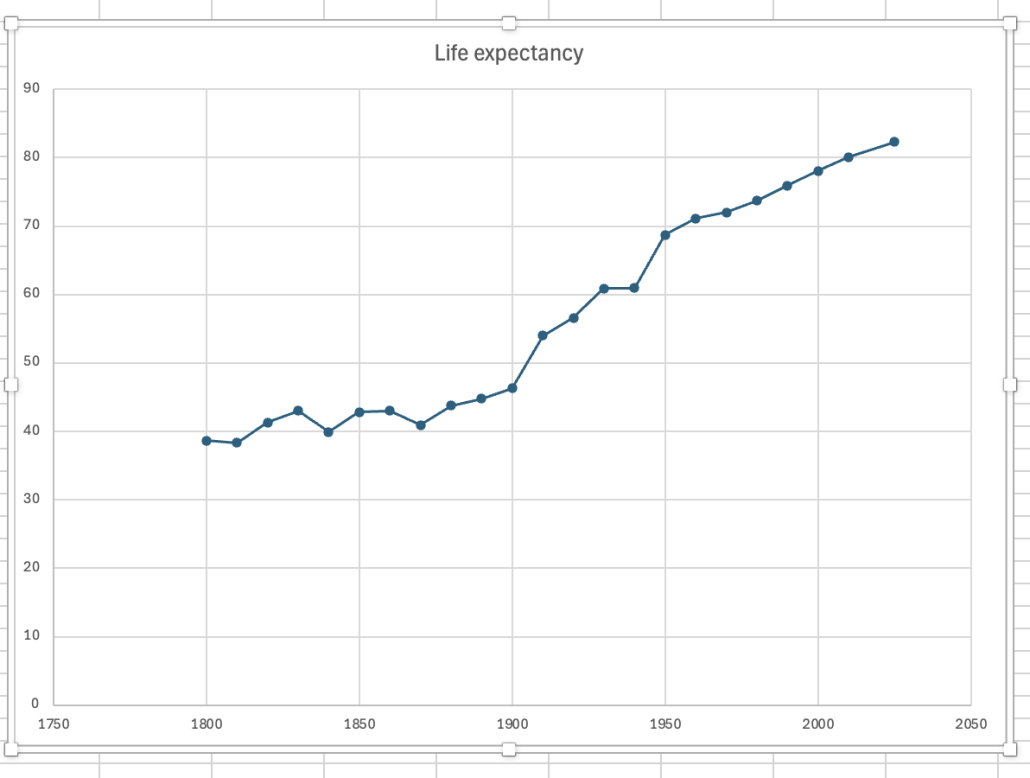
I have produced a graph of UK life expectancy over the years. It starts from 1800 and contains data for each ten year period. Again this is an average and in the first hundred or so years child mortality was so high it skewed the average. Where the average is shown as 40 years or so, in reality those who survived to be 40 probably lived to be 50 or 60 odd. If you have a family tree take a look at those born in the early 1800s and see how long they lived. The world wars also had some influence on life expectancy, especially the first one though you can’t really see this because of the ten year gap I used.
I then took the ONS data for England, Scotland and the UK that shows how many more years you can expect to live at a certain age. Just to be scrupulously fair I used my own age (74) and it shows how much longer men can expect to live. Had I been 74 in 1980 I could have expected another 8 years, now I can expect another 12 years through no fault of my own. On the other hand at 74 in 1980 I would have been born in 1906 and have lived through two world wars and the depression. Being born in 1951 means I suffered no world wars and grew up in times of plenty.
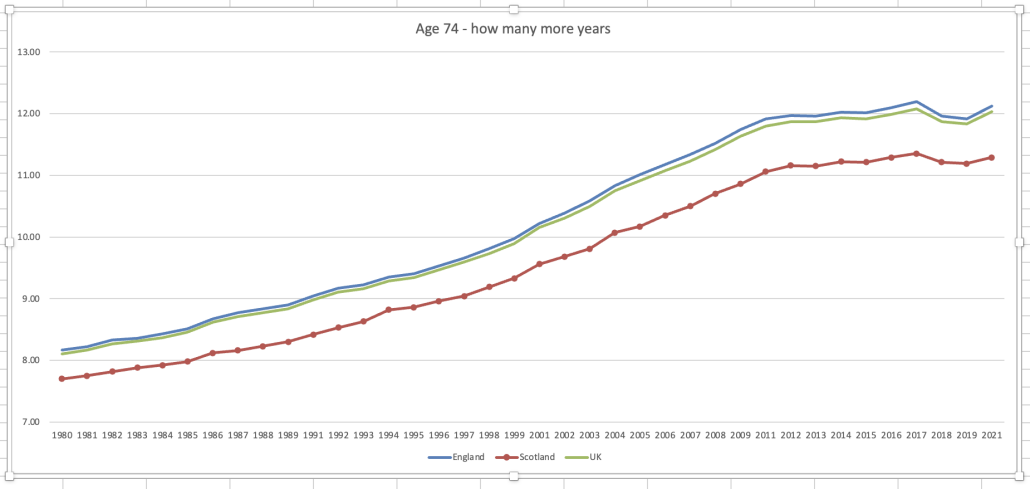
The poor Scots have a lower life expectancy than the English by 0.47 in 1980 to nearly one year now. I should imagine the temperature difference covers a fair amount of that. You can also see a bit of a dip in 2019/2020 as the Covid scam arrived. The ONS have previous when it comes to fiddling the Covid figures.
I fully expect to be shot down in flames as puffins react to my theories. I fear I have an inbuilt bias because I trust the medical profession just as far as I trust politicians so that is my inbuilt bias. I think doctors are aware they should give patients confidence in their work but it has gone too far and they don’t know as much as they might like to about our health. When you go to see a GP the first thing they do is consult Dr Google. The only difference between us and them is that they understand the terminology better than we do. We use many medical buzzwords but with a different meaning than a medical professional would recognise.
As far as Covid goes, the last real figures in this chart are those for 2021, they have figures for 2025 but they are a projection. Those who are convinced Covid did a real cull will be able to decide when the subsequent figures are released should that ever happen. I expect a few cuts at ONS so the lies can continue.
If we keep extending our longevity Keith will be forced to introduce carousel to cull our numbers unless the best laid plans of Gates and Soros come to fruition.
© well_chuffed 2025


