
Wikimol, Dschwen, CC BY-SA 3.0, via Wikimedia Commons
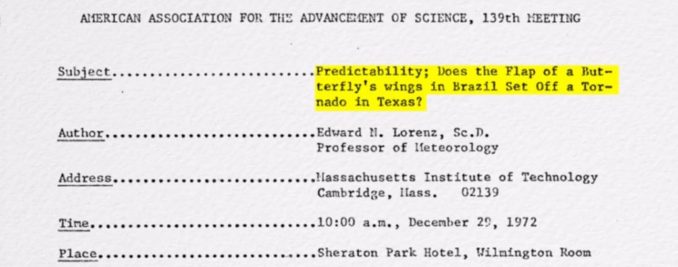
On Dec 29th 1972 a paper was submitted to the American Association for the advancement of Science. The author, Edward Lorenz was an MIT professor of meteorology and the subject of the paper was:-
Predictability; does the flap of a butterfly’s wings in Brazil set off a tornado in Texas?
The subject matter linked to academic observations frequently made in the late 60’s but which only spread into the public consciousness after the publication of this paper. Now, if you google Butterfly Effect, the number of hits will be unlimited as references abound to this phenomena in movies, plays and the web. However, most of the folks I’ve talked to about this (especially the young) only have a rather narrow sense of what it means.
What I want to do today is explore this and linked issues with significant relevance to our weather… the first is sensitive dependence on initial conditions (something we looked at with the help of bunnies in a previous article) and the second are attractors… which are one of the few reasons I ponder about the climate.
D-Day
During the D-Day landings, the allies needed a full moon, low tide, low cloud cover and low or very light winds. Allied meteorologists, led by Group Captain James Stagg, only had military and civilian surface observations to go on (no satellites, computers, weather radar nor fast communications). The weather looked awful until Stagg noticed one observation from a vessel stationed hundreds of miles west of Ireland where the barometric pressure kept rising. Coupled with readings of wind speed he knew that high pressure could effectively push storms away from the vicinity of the landing sites – and it was this observation that led him to tell Eisenhower on June 4th that the weather would improve.
Ironically, if the weather had been better before the landings, ze germans might have spotted our huge build-up of troops, so bad weather actually did us a favour (as did Hitler, by having an early night – bless). But on the day itself, the pathfinders ran into low cloud base and dropped sign beacons in the wrong places and the paratrooper planes, under a hail of antiaircraft fire, had an extremely hard time getting troops anywhere near their intended targets. It was all far from perfect, but it was just good enough for footholds to be gained. The rest is history… and a good lesson in the value of weather forecasting.
…and why shouldn’t weather be forecastable? After Newton derived his three laws of motion, everything felt like it should be completely predictable. Our solar system, eclipses and comets all became easy to predict and phrases like “the clockwork universe” entered public discourse. The French philosopher Pierre-Simon Laplace put it rather well in a thought experiment involving an all knowing being who knew everything about the current state of the universe. Laplace reasoned if this intellect was vast enough, it could analyse every single particle, in which case the future, just like the past, would be present before its eyes.
Laplace wasn’t just referring to particles and stuff that moved. He was also tipping his argument in our direction, suggesting we were all living in a deterministic system… where the future is fixed and all we’re doing is waiting for it to happen. Thank God for religion, which threw the almighty spanner of free will into Laplaces’ thinking and also to Newton himself, as it wasn’t long before the three laws of motion were applied to more complex arrangements of planets, only to find that a set of merely three bodies was sufficient to completely evade prediction attempts. The so called three body problem caused Newton many a sleepless night and nicely confirmed that a clockwork universe was simplistic and wrong. Nonetheless, even today vestiges of this irrational thinking pops up, for example in this piece written in the guardian… a paper that always pleads for my money, but which I decline to give… free will. In fact we now know that even our solar system, the very epitome of stability, is not at all stable over long periods of time. Wait long enough and the current planet configuration will have changed completely with some planets leaving us and others heading for the sun.
Modelling
In the mid to late 60’s, computing power was becoming more available and meteorologists were using machines to model the weather but still heavily influenced by Laplace thinking. They were sure that with the right equations it should be possible to predict weather far into the future and increasing efforts were made to that end.
Edward Lorenz began working at the prestigious MIT in 1948 and up to the mid 60’s worked on circulation patterns within the atmosphere (trying to understand how energy and circulation were combined). In parallel (and this was closely linked to the increasing availability of computing power) Lorenz began working on numerical weather prediction, which was a real switch from the linear statistical methods commonly used by forecasters back in the day. They analysed likelihood in order to figure out what would happen next but Lorenz wasn’t keen on linear… believing that weather was highly non-linear and he was right, too.
He started by looking at observable and easily measureable data – such as wind speed, wind direction, temperature, air pressure, humidity etc and came up with 12 fairly involved equations, each predicting one of these measurable things. You’d plug in starting values and get the first set of 12 values predicting temperature, air pressure, humidity etc, for now on this imaginary planet – this would be iteration 1. Then the next set (ie: iteration 2) of 12 values would tell you the temperature, air pressure, humidity in say a minutes time. The third set (ie: iteration 3) would show the state in 2 minutes time and so on. By the time you’d get past 60 iterations you’d be able to see the next hour and past 1440 iterations would predict the weather for the next day.
Lorenz only had access to a humble (valve) computer… an LGP-30, manufactured by Royal McBee, a typewriter company and appropriately, that system used a paper printer for its display. But getting all 12 equation results on the printout meant that he had to condense the numbers to just 3 decimal places. Not a problem, thought Lorenz, because the machine internally calculates to a whopping 6 decimal places. Lorenz kicked off various runs on the computer with thousands of iterations printed on dozens of pages. He’d then take the print outs and use pen and paper to work through what these were predicting in terms of temperature, wind speed and so on.
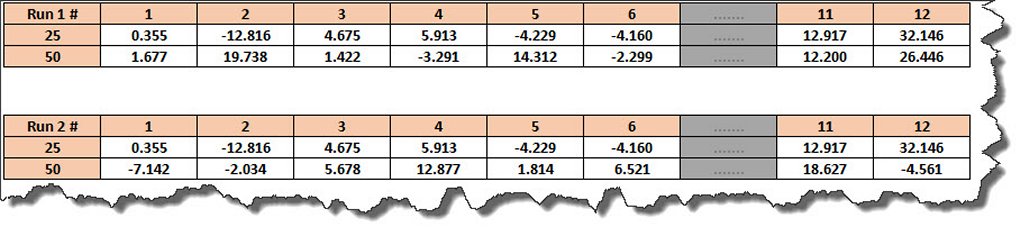
There was one particular run where Lorenz wanted to see the data again, but instead of restarting the run right at the start, he plugged in 12 values read from iteration 25 (see below) and kicked off the computer at which point he spotted something odd (which you and I have already explored with bunnies in my previous post). For the first few iterations, the original and new weather predictions remained close together but by the time the machine had reached further on (iteration 50 in the example below), the two weather system predictions had separated. The longer the run, the further that separation became.
Why?
Lorenz imagined the LGP-30 wasn’t working properly, but all tests confirmed that it was. He even simplified his 12 equations down to just three (modelling an even simpler weather system) thinking his model was causing the problem, but that didn’t fix it either. Eventually he realised this change had occurred because the figures he’d used from the original run were taken from the printout and those figures were only shown to 3 decimal places of accuracy. As he said at the time:-
This was enough to tell me what had happened: the numbers that I had typed in were not the exact original numbers, but were the rounded-off values that had appeared in the original print out. The initial round-off errors were the culprits; they were steadily amplifying until they dominated the solution.
In other words, a tiny reduction in accuracy (in the order of thousandths of a degree of temperature or thousandths of an MPH of wind speed) had somehow caused the prediction of the weather system on this imaginary world to violently change.
Ponder this for a moment.
- How can you predict anything if even the tiniest change will completely alter the predicted outcome?
- If predictions are sensitive to the tiniest error – then how on earth can you reliably measure something as difficult to pin down as wind speed or temperature? Temperature measured at an airfield is going to be very different to the temperature measured in a rural town – given there is no such thing as a constant temperature across any large body (be it ocean or land mass).
Although it isn’t accurate to compare this to Heisenberg’s uncertainty principle there is a slight resonance between these two axioms in the sense that precision measurement of any complex system may be far more difficult than we realise and perhaps out of our reach altogether. There is another curious paradox here (which wasn’t lost on Lorenz). On the one hand he had his 12 equation model which is a perfect deterministic system, one that Laplace would have liked. You start this system with some set of values and run it millions of times. Tomorrow, repeat the same process and you’ll get exactly the same results. It is, in this regard, fully deterministic.
However, introduce even the smallest error between two of these systems running together and within a few hundred iterations the two won’t be vaguely comparable. By the time you get to a million iterations, you won’t even know they’re running the same underlying modelling equations at all.
This is referred to as (extreme) sensitivity to initial starting conditions and is what Lorenz meant when he coined the phrase The Butterfly Effect: where immeasurably small changes made by a butterfly’s wings can send a planetary weather system headlong into a completely different place. Sensitivity to initial conditions is a key problem for long range weather forecasting – because there isn’t sufficient precision nor accuracy to measure all the millions of inputs feeding into a weather system in order to achieve anything like accurate prediction.
The UK’s Met office try to get round this by modelling thousands of different starting points simultaneously… the idea being that they may find a kind of consensus where many modelled starting points essentially end up with the same sort of outcomes. According to them, this improves accuracy, however in 2009 the Met office (using this technique) issued a long range 4 month seasonal forecast of hot sunny weather claiming that the UK was odds on for a barbecue summer. Instead the summer was predominantly wet. After the met office revised their prediction to unsettled weather the MSM nicknamed them the wet office. Firmly in a hole of their own making, the wet office continued to dig by saying: Seasonal forecasting is still a new science. It’s something we’re still building on – and build they did, for that same year they went on to make sure they also got the winter weather wrong… telling us reassuringly that we only had a 1 in 7 chance of cold weather. In 2009 we shivered in the coldest winter for 30 years. Long term seasonal forecasting was quietly dropped by the wet office after these back-to-back cock ups, not that the BBC ever reported it.
Extreme sensitivity to initial conditions sets a very tight limit on our ability to predict the behaviour of any non-linear system so any time you hear the word prediction and weather (or finance) in the same sentence, beware.
Long term weather prediction is an oxymoron.
Anyone who thinks otherwise (including the asinine deluded eco-nutter soap dodging cultists in Just Stop Oil), is wrong.
Attraction…
When I first met my wife, I fell into her orbit and have wanted to remain there ever since.
Me
Lorenz wondered what would happen if multiple sets of predictions, all starting from almost (but not exactly) the same values, were run to compare one prediction against another.
How different would they be?
He found they would start identically and stay very close for a while (maybe 10’s of iterations) but in time, not only would the weather predictions change they would in time violently differ, to the point of no meaningful comparison at all. His next step was to plot these to visually compare the differences.
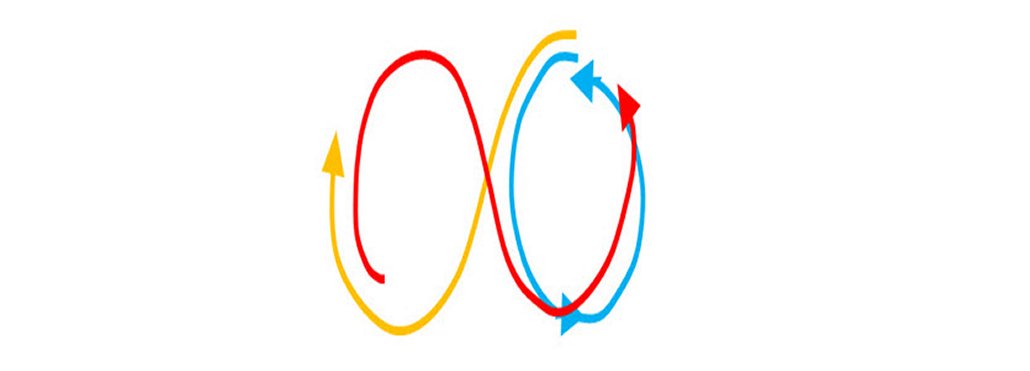
The plotted points start in the same way but before long they slowly split up.
In the diagram below you can see three temperature prediction runs, coloured yellow, red and blue and where all three have very nearly but not quite identical starting points. These traces are shown after approximately 500 iterations and you can see that the yellow temperature prediction is moving in one direction from high to low values, the blue remains circling a point of high value (in other words it is predicting values largely on the high side of the graph) while the red is moving between low and high values in the opposite direction to the yellow. Compared to one another all three are significantly different but note that they appear to loosely orbit two spots.
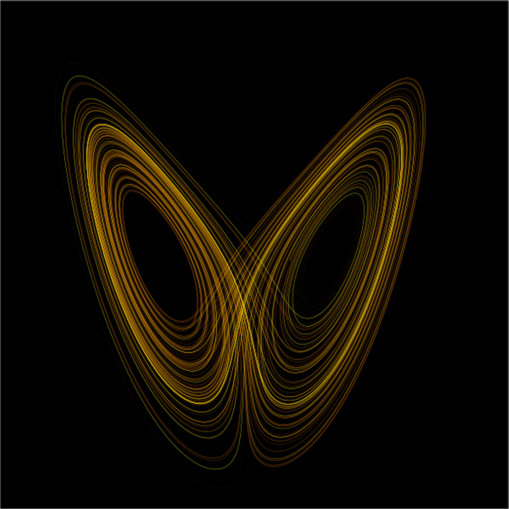
He was intrigued by the way these predictions tended to circle and so commanded more computing time on a larger machine to run millions of iterations to figure out if this was a pattern… and that’s when he found there was indeed a deeper type of order… and funny enough, it had a vague resemblance to a butterfly.
Dan Quinn, CC BY-SA 3.0, via Wikimedia Commons
Although the plots for different systems are wildly divergent when one is compared to another… all the systems exhibit a tendency to loosely stabilise around two points.
The entire area encompassing all the movement of this plotted prediction data is referred to as phase space… which basically means the area enclosing the extremes of whatever the complex system does. As the plots tend to oscillate around two points in space, Lorenz thought of these as attracting the plotted points… sort of like a sun attracting the earth, which with its own speed then orbits around it. These became known as Strange Attractors because Lorenz couldn’t explain why they were there (although in modern vernacular, the word strange is generally dropped).
There is an important and highly relevant point to grasp here which I’d like to illustrate with three examples of non-linear behaviour linked to sudden long lasting change.
In any complex system, be it financial, weather, biological, geological – there will be attractors which the complex system will tend to orbit around and often for extended periods of time. However the phase space for complex systems is generally large and likely to contain multiple attractors. As the system oscillates around some attractor, that oscillatory action may result in what we might think of as fairly favourable, calm and rather pleasant conditions, accompanied by the occasional bump and hiccup along the way. For example a weather system over long periods may be fairly benign, albeit with the occasional tornado, heat wave, beast from the east (whatever) thrown in to keep us company but over the long term it might be thought of as essentially quite pleasant. For example, the interglacial period we live in now. Generally (but not always) good for crops and us.
But another attractor, perhaps located nearby in the phase space of all possible places that a weather system might go, may result in the same system exhibiting violent and really very unpleasant conditions – for example, a period of glaciation. Precisely what switches a complex system happily orbiting one attractor to start orbiting another is extremely difficult to predict and not at all well understood. Equally, the stickiness of an attractor (its tendency to hold a complex system in its orbit) is extremely difficult to quantify.
In modelled systems, the nudge required to move a system between attractors can be remarkably small if just the right nudge occurs.
Stop and think about what that means!
When Galileo started observing Jupiter with one of the first telescopes, he noticed it had a red spot. We now know that this spot is actually a huge storm with a slight oval shape and which is roughly 10000 miles wide (wide enough to swallow the earth). It is a very good example of an attractor where the complex weather system on this gas giant results in a body of concentrated vortexes that have lasted for centuries. The spot changes, it is far from a static system but broadly maintains a stability of its own. Some scientists predict it will die out in 20 years, although the evidence remains extremely uncertain.
What is interesting is that it occurred and persists. The storm self organises, held bound by this particular weather system attractor.
What would happen to Jupiters’ weather if it suddenly collapsed?
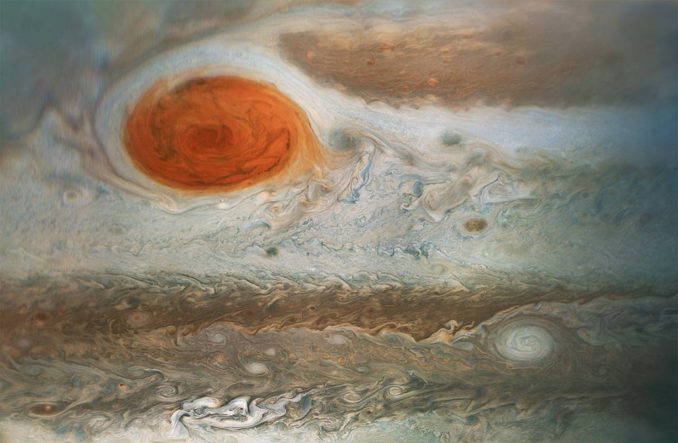
NASA/JPL-Caltech/SwRI/MSSS/Gerald Eichstädt/Seán Doran, Public domain, via Wikimedia Commons
In financial systems you may enjoy long periods of modest growth. During this period, governments will inject change and citizens’ behaviour will also inject change to the system as a whole. Some will be good, some bad. Nations will inject change – perhaps due to tariff control, government control and even wars… but if these complex non-linear changes don’t violently impact on the system the overall direction is likely to remain in orbit around an attractor that we might refer to as slow-and-steady. Sometimes slow-and-steady results in the system heading into prosperous growth and extended periods of peace while other times the system might dip into stagnation, loss or perhaps a small war and so each year might bring a good pay packet while some years will be lean and possibly difficult, but speaking long term the orbit of slow and steady might end up with many decades of fairly comfortable results.
However, the phase space of financial systems is large… and in 1929 a number of changes over the previous decade resulted in the US financial system moving out of the orbit of slow and steady directly into the orbit of a new and desperately unpleasant attractor where it remained bound for many years. One could argue that WW1 was the first nudge. Citizens’ irrational behaviour with the stock market, leading to a supersized bubble was the second big nudge. The eventual crash of the Stock Market was nudge number three. Protectionist policies such as the Smoot-Hawley Tariff, designed to control over-production and import costs led to the collapse of world trade and as governments flailed around trying to gain control, their own policies made matters far worse… nudge number four. Citizens’ behaviour came back to compound the problem with runs on banks, directly resulting in bank failures, losses and panics leading to the collapse of money supply and almost like a nasty icing on an already horrible cake, a great drought occurred, largely as a consequence of decades of poor land management decisions and federal policies coupled with significant changes in regional weather.
By 1929 the system shifted into the great depression. If such a thing could be visualised, then long before that year, the slow-and-steady financial system would have started wobbling and oscillating in odd ways. Deviations would have become larger and trace plots would have started veering into and back from areas of phase space normally uninhabited by the system. As each change occurred, the wobble would have become more pronounced until eventually the system would snap, heading to a totally different area of phase space only to become captured by a new attractor: the great depression.
10000 years ago our climate moved from the glacial period to the interglacial period that we live in now. No one has a clue why that change of attractor occurred. Some argue that it was provoked by a change to the tilt of the earth. One google result recently informed me that Ice ages could be caused by changes in the Earth’s orbit, in the tilt of the Earth’s axis, by plate tectonics, volcanic eruptions, or asteroid impacts – so basically anything could have caused it.
No one knows why this change happened, at either end (in or out of the glacial period).
We do know that the Earths weather can and often has entered extended glacial periods in the past. We also know that the triggers required to initiate change both ways (from the glacial period attractor to the interglacial period attractor) had nothing to do with man and it certainly had nothing to do with industrialisation but in all other regards we don’t know what caused this change.
Uncertainty with CO2 …
This uncertainty is the one aspect of the climate that I do find interesting. There are 8 billion of us on the planet now and obviously we are making a difference, but the degree of difference we make appears to be tiny. The modelling of complex systems gives me pause, for it tells me that even small nudges to a system, regardless of what those nudges may be, can have deeply significant outcomes.
But, I don’t believe for a second that CO2 is a significant nudge. Even if you do subscribe to our politicians claim that CO2 is enemy #1, then it may be worth remembering that a volcano can belch more CO2 than was emitted during the entire industrial revolution, right up to the modern day. In regard of scale, any precautionary principle controlling carbon dioxide feels like borderline nonsense and even more of a joke when countries the size of China and India not only refuse to play ball but laugh at our meagre, hamstringing, attempts at control.
Life would cease without CO2, a fact rarely mentioned these days as politicians busily cast a vanishingly small amount of this atmospheric gas, as a bad guy. I look on at a bewildering level of irrationality and wonder how much of a difference Boris thought the UK would make by driving headlong down to the unreachable goal of Net Zero?
Did he and his ilk even understand what they were doing, no doubt all based on the science?
…but which is actually based on predictions, that you and I know can’t be made.
© Verax Cincinnatus 2023


