This is likely to be very boring, but I’m going to try to explain how the bond market works and why so much attention is paid to the 10 year gilt level.
Initial primer
Bonds are the method that governments and corporates use to raise money for short or long term funding. They pay either a fixed rate of interest for a predefined period or a variable rate, the latter defined by short term interest rates set by the central bank. The ability to raise money depends on the view of the buyers, usually our pension funds and insurers, of the relative risk of lending for a term longer than a couple of years. This is based on a future look at inflation and the amount the government needs to borrow versus the appetite for buying it. The pension funds and insurers are a captive audience to a great extent as their liabilities – the money they pay out in pensions or claims – require them to hold assets which match their expected payouts.
The yield curve
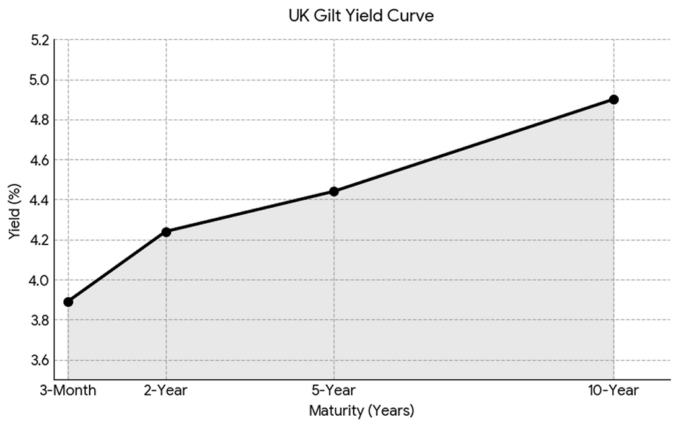
This looks at the relationship between the rate set by the Bank of England via its base rate (now renamed I think) and how much the Treasury (the borrower) needs to pay to borrow at a fixed rate for a longer period of time. So currently, the base rate is 3.75%, but the government needs to pay 5% for funds with a 10 year maturity (Gilts). The gap between the two is the yield curve. If it slopes up steeply, this represents a lack of confidence in the future – inflation or overborrowing – or a fear of a rise in the base rate.
This is because if investment money could borrow cheaply, at the base rate, with confidence that it wouldn’t change over time and there was a profit to be made by buying 10yr Gilts, even if small – they have almost unlimited balance sheets – they would do so.
This is the current shape, with short term rates at close to the 3.75% base rate but 10yr at close to 5%.
The Measure of Confidence
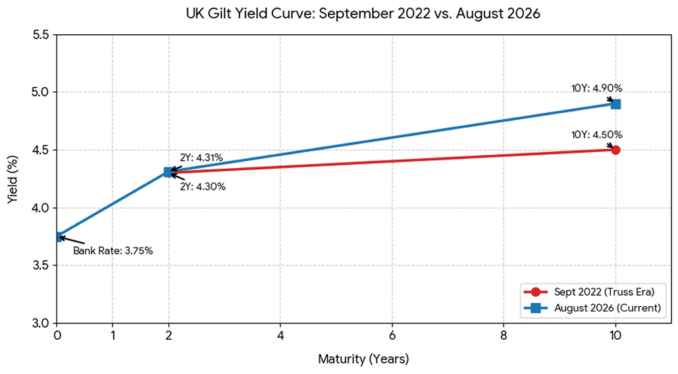
The lefty twats talk about the Truss crash when Gilt yields spiked. They were still below where they are now, and the base rate has been cut several times, so the yield curve has steepened, as 10 year rates relative to short term ones are much higher. With the spread between cheap short-term money at a recent high, the rise in 10yr rates is expressing a much deeper, more calculated lack of confidence in our long-term fiscal trajectory than anything seen during that brief Truss panic.
If you’re still awake, this one shows the shape of the curve since 2020, with the huge economic panic of 2020 and the rather limited Truss factor. The BoE not only started raising rates, but also announced it was going to reverse the gilt purchase programme and start selling them instead. Coincidentally as pork markets was unexpectedly semi-voted-in.
Starting from the same point:
Conclusions
The shape of the yield curve represents the confidence that those of us who pay the bills will be either unable or unwilling – the Laffer curve is well known – to be able to fund it, and the debt the government is continuing to take on.
Fuck, I’ve even bored myself and I used to work in it. Sorry.
Featured image: Open Grid Scheduler / Grid Engine, CC BY-SA 4.0, via Wikimedia Commons
© Stun12 2026