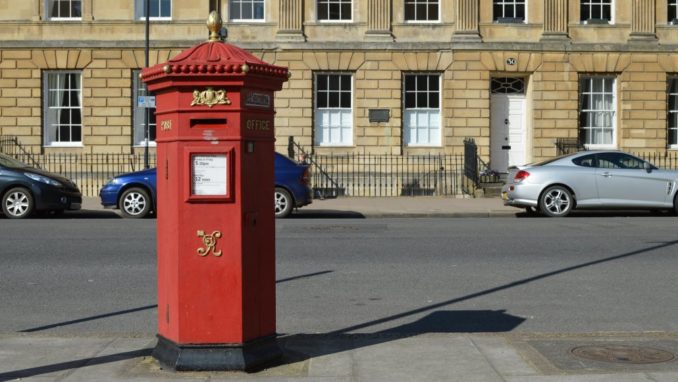
Matt Brown- Licence CC BY 2.0
After the description of how Postal Voting works and by implication, how much it must cost, it seemed worth while looking at the number of overseas postal voters. These should mainly be people who have moved abroad in the last 15 years or so who are still allowed to vote, well, it seemed so obvious. Reputedly, certain areas use more Overseas Votes than others.
The following statistics have been extracted from the Electoral Commission’s breakdown of the 2016 Referendum voting.
Firstly looking at the percentage of Overseas to Total Postal Votes. In percentage terms Oxford is first with %15.45 of its postal votes being sent abroad and Cambridge is fourth with %13.48, maybe it’s a student thing. Camden and Westminster provide the meat and mayo in the sandwich of the top four with %15.04 and %13.74 respectively. There seems to be no total of how many Overseas Postal Votes were returned, just how many were issued.
Tower Hamlets would figure highly in anyone’s guess of where lots of Overseas Postal Votes might be found. With an electorate of 167,820 and 108,420 actually voted, 31,482 Postal Vote packs were issued of which 22,940 were included in the count. Overseas Postal Votes were 3,076 which is %9.77 of the Postal Votes that were issued.
In terms of sheer volume nobody will be surprised to learn that London figured highly in the Postal Votes stakes.
| Where | Electorate | Voted | PostalVotes | PostalReceived | Overseas |
| Wandsworth | 219,521 | 158,018 | 47,760 | 40,169 | 6,012 |
| Barnet | 223,467 | 161,218 | 48,319 | 41,229 | 5,038 |
| Lambeth | 210,800 | 142,162 | 33,370 | 28,031 | 4,306 |
| Leeds | 543,033 | 387,677 | 113,169 | 96,963 | 4,209 |
| City of Edinburgh | 346,073 | 252,481 | 80,034 | 69,709 | 4,160 |
| Camden | 145,425 | 95,281 | 26,757 | 20,255 | 4,024 |
| Cornwall | 419,755 | 323,442 | 81,949 | 73,514 | 4,004 |
| Rich. upon Thames | 132,632 | 108,876 | 29,533 | 29,328 | 3,806 |
| Bristol, City of | 312,465 | 228,646 | 59,571 | 53,008 | 3,764 |
The table above is the top 9 areas with the highest number of Postal Votes.
As far as the UK as a whole is concerned we have the following statistics
| Electorate | 46,500,001 |
| Votes Cast | 33,577,342 |
| Postal Votes Issued | 8,535,750 |
| Postal Votes Cast | 7,475,912 |
| Overseas Votes Requested | 335,379 |
The areas with to highest numbers of postal votes are
| Area | Electorate | VotesCast | PostalVotes | PostalReceived | Overseas |
| Leeds | 543,033 | 387,677 | 113,169 | 96,963 | 4,209 |
| Sunderland | 207,221 | 134,400 | 90,737 | 75,007 | 574 |
| County Durham | 389,507 | 267,546 | 87,048 | 74,761 | 1,556 |
| Sheffield | 396,406 | 266,951 | 86,281 | 74,825 | 2,301 |
| Cornwall | 419,755 | 323,442 | 81,949 | 73,514 | 4,004 |
| City of Edinburgh | 346,073 | 252,481 | 80,034 | 69,709 | 4,160 |
| Birmingham | 707,293 | 451,316 | 77,561 | 64,625 | 2,323 |
| Newc. upon Tyne | 190,735 | 129,072 | 75,927 | 65,944 | 1,117 |
| Wiltshire | 366,555 | 289,102 | 75,120 | 66,531 | 3,107 |
Postal votes seem to be extremely popular in some areas, nearly 25% of votes in Leeds are postal. In Newcastle and Sunderland it’s closer to 50%. Remember there are 8 and a half million Postal Vote packs that are posted or delivered to the electorate. Over 1 million of those are not used to vote.
© well_chuffed 2019
The Goodnight Vienna Audio file


