
Fracking is once again in the news, once again you will hear of the dire consequences, the disasters and the earthquakes caused by drilling and fracturing the shale underground. It was suggested that the proposed fracking at one site, in Sussex I think, would cause trains to fall from a nearby viaduct.
If you ask people about the scale of earth tremors you will find that most have no idea of how they are measured, perhaps a vague idea of ‘The Richter Scale’.
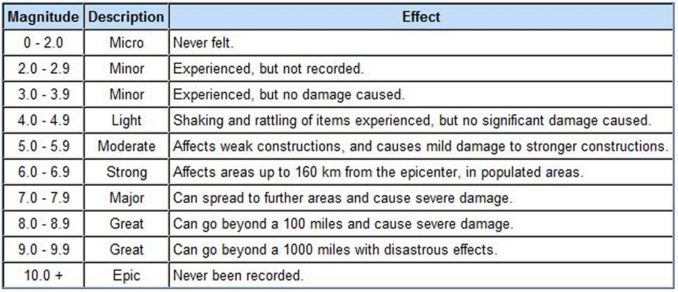
They might be aware that the largest ever recorded was about a ‘9.5’ and the one that put the nuclear power station in danger in Japan was a ‘9.1’.
They might have read or heard on the news that the ‘safe limit’ put on the fracking test.
drilling recently was 0.5 on that scale.
Fair enough, say those who can do sums, that’s reasonable because it’s 0.5 over 9.1 and that’s about one eighteenth of the power that nearly wrecked a power station.
But, of course, it isn’t.
Nowhere near.
It is one billionth of the power of the greatest ever, about one four hundred millionth of the power of the Fukushima nuclear power station event.
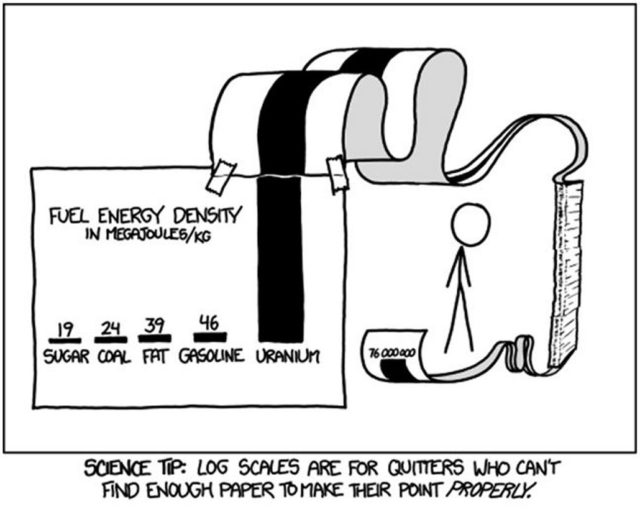
The scale used for earthquakes is a ‘log scale’, a logarithmic scale. It is used to avoid the world supply of paper being used up all at once *
Before calculators were invented schoolchildren were instructed in the use of logarithms. These were used to calculate multiplication and division problems, an easy way of doing hard sums without the labour plodding through multiplying or dividing each bit in turn.
Each pupil was given a book of ‘log tables’, some clever people had done all the workings out, done the clever bit, the pupil had to look up the ‘log’ of a number and write it down, then the log of the other number, and add it to the first if multiplying or subtract it if dividing. The result was a number which was looked up in the ‘antilog’ part of the book, the number found there was your answer, the decimal place position was then decided.
Log and antilog tables can be found online
a simple one is at Log and Antilog Calculator
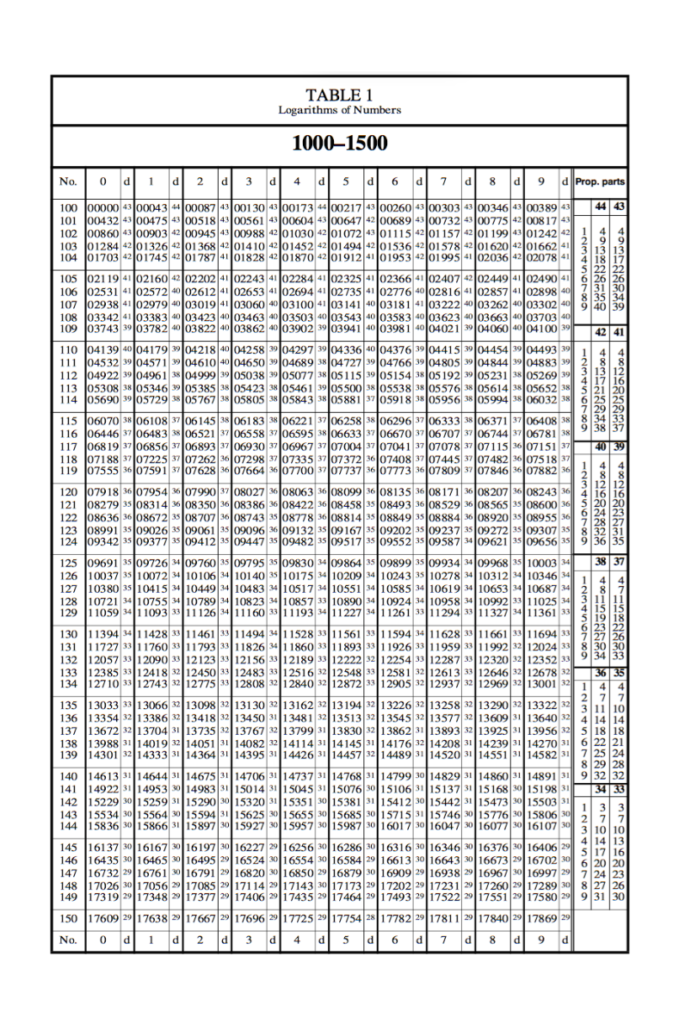
Nathaniel Bowditch, originally; National Imagery and Mapping Agency, U.S. Government, Public domain, via Wikimedia Commons
When the pupil was more advanced, probably at college or in A level studies, the ‘slide rule’ was used. This device had log scales engraved on it and some fiddling with the slide and the cursor made the adding up, and looking up, easier but less accurate (but accurate enough for real world situations).
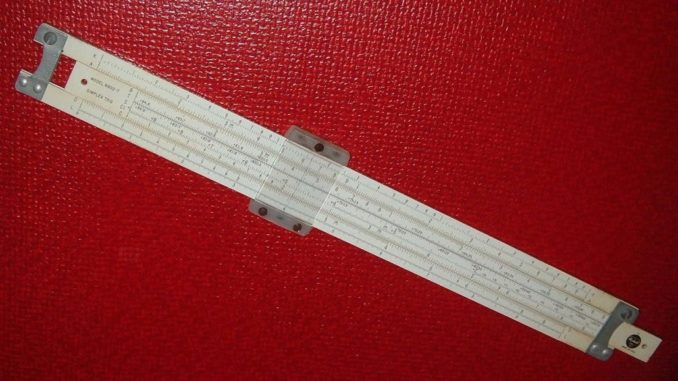
ArnoldReinhold, CC BY-SA 3.0, via Wikimedia Commons
Simply stated, the log scale used for earthquakes is such that each number along the scale means it is ten times more ‘powerful’. Add zeros as you go along, a 2 is ten times a 1, a three is a hundred times, 4 a thousand times and so on. A 9.1 has nine zeros, that’s a billion times a 1.
Doing it this way you can produce a graph or table with numbers going from one to ten, a lot more convenient and space saving than one to ten billion.
The number of 0.5 the so called safe limit, is a ‘log of the real number’ Look this up in the on line ‘antilog calculator’ and you get a ‘real’ number of 3.16.
If you look at the antilog of a ‘2.1’ scale tremor, a tremor which might just be felt, you get a real number of 125.
You will see that a tremor which can just be felt in ideal conditions is 125/3.16 times, which is about forty, times the power which has been said to be the ‘safe limit’.
The antilog of the 9.1 Fukishima event shock is 1,258,925,412, divide this by the 125 of the tremor that can just be felt and you will see that it is an enormous 1,000,000,000 times stronger and not the 18 that was mentioned earlier that you’d guess if you thought they were ordinary numbers, not on the log scale.
There is another scale that is used to scare people, a ‘linear’ scale, ordinary proper numbers, not logs, but applied to deceive. We’ve all seen the pictures of wells drilled through water tables. This is said to be very dangerous if it’s a fracking bore hole, strangely it isn’t a problem when sewers pass through or under water tables. The water table is usually shown as a thick layer just under the surface and the shale layer just below that, it will not be drawn to scale, to save paper or to deceive?
*
Uranium is stated to have 76 million MJ/kg, while the next highest material shown on the graph (gasoline) has 46 MJ/kg. Thus the uranium graph should be taller by a factor of 76,000,000/46 = 1.652 million. So, if the gasoline graph were 9mm in height, the uranium graph should be a bit more than 14.868 million mm tall, or nearly 15 km (9.2 miles) tall.
From https://www.explainxkcd.com/wiki/index.php/1162:_Log_Scale
N.B Logs in this article are to base 10, don’t worry your head about it, there are also logs to base e, for smartarses.
Featured image: Unknown authorUnknown author, Public domain, via Wikimedia Commons
© GrumpyAngler 2022


